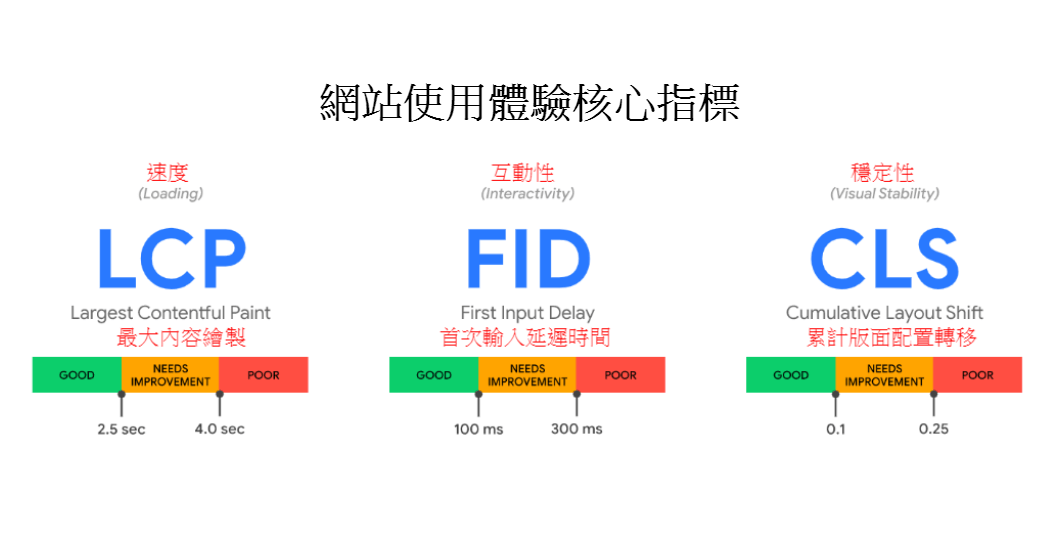
In May 2020, Google’s Chrome Team defined the three most important indicators for measuring website user experience - LCP, FID, CLS, major website performance testing tools have successively adopted this as a standard, and Google Search has also announced that it will list them as SEO ranking factors. This article will introduce these three indicators, why they are important, how to test them, and what the standards are.
- Website experience indicator (Web Vitals) project introduction
- The relationship between the Web Vitals project and SEO
- LCP (maximum content drawing)
- FID (first input delay time)
- CLS (cumulative layout transfer)
- Web Vitals Measurement/Monitoring Tool
- Conclusion
Website experience indicator (Web Vitals) plan
Website experience indicators (Web Vitals) are a project of Google, launched in May 2020. The purpose ofis to provide unified metrics for all websites, allowing website owners to quantify the user experience when browsing the web., find out the crux and optimize it.
Google currently lists LCP, FID, and CLS as three "core indicators" in website experience indicators., these three indicators represent the "loading speed", "interactivity" and "stability" of a web page respectively. Core metrics may change in the future over time or as technology advances. There are of course core indicators and "general" indicators, such as TTFB, FCP, TBT, TTI... etc., which are currently auxiliary general indicators.
The relationship between the Web Vitals project and SEO
SEO and user experience (UX) have always been inseparable. This is not difficult to understand. Google does not want the web pages ranked at the top of the search results to give users a bad experience.
However, user experience is very difficult to quantify. Generally, web pages can be tested through A/B testing to see which version has a better user experience. However, from a search engine perspective, it is quite complicated to find this unified indicator that applies to all websites.
Chrome Team selected these three most representative indicators after extensive research, and Google Search Team also announcedMay 2021will initially add these three indicators to the website’s UX score and become SEO ranking factors.

based onGoogle Research, if a webpage can control all three indicators in the "excellent" range, the probability of users leaving the webpage when the page is loading will be reduced by 24%.In addition, Google recommends setting a goal of 75%, and webmasters should allow more than 75% of users to have an excellent experience.
| Excellent | Normal | Unqualified | |
| LCP, maximum content drawing | <2.5 seconds | 2.5 seconds~4.0 seconds | >=4.0 seconds |
| FID, first input delay time | <100ms | 100ms~300ms | >=300 milliseconds |
| CLS, cumulative layout transfer | <0.1 | 0.1~0.25 | >=0.25 |
What is LCP?
LCP, Largest Contentful Paint or "Maximum Content Drawing", calculates the time required to load the largest content element in the viewport of a web page. In other words, this indicator marks the time it takes for users to see the main content on the page, which is equivalent to the first impression of the web page.
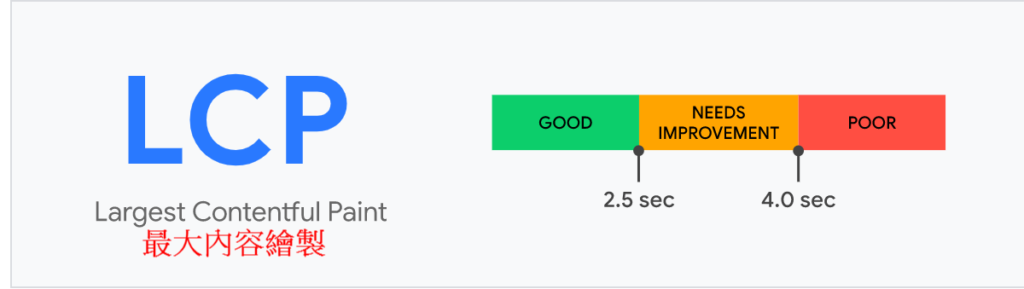
standard:The threshold set by Google for LCP is 2.5 seconds. Less than this number is considered a good website experience. In addition, the website must have at least 75% of users reaching LCP < 2.5s to pass.
LCP example
LCP will change. In the CNN example below, you can see that the LCP in the first frame is "Visual Stories" in the green frame; in the second to fourth frames, the determined LCP is the title; and then the LCP in the fifth frame is the picture below the title.
Because this picture is the largest content element in the last visible area, the final LCP of this page will be calculated based on the time it takes to load this picture.

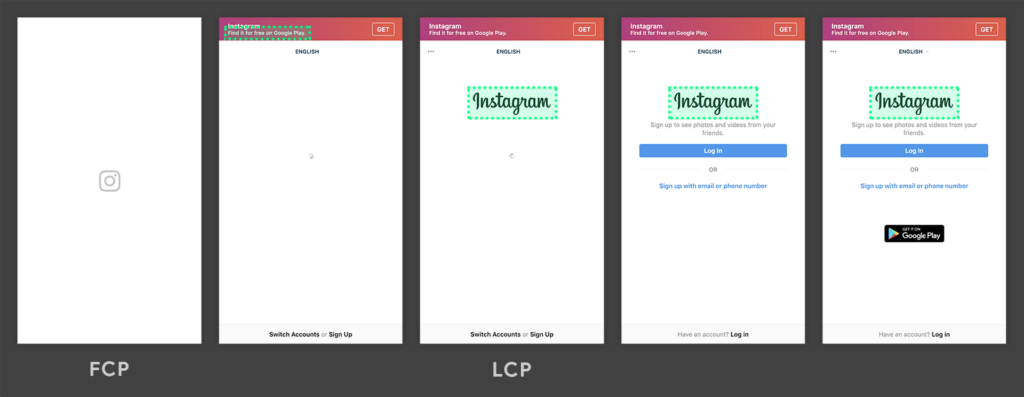
In the example of Instagram below, the largest content component (IG's logo) has been loaded in the third frame. No larger component appears in the visible area of the web page after loading, so the final LCP of this page is calculated based on the time required to load the logo.
LCP in user experience
Largest Contentful Paint (LCP) is the representative of "speed" among the three core indicators. There are many other indicators to measure speed, such as FCP (First Contentful Paint), FMP (First Meaningful Paint), TTFB (Time to First Byte), etc., but LCP stood out and was selected as the core indicator of user experience because Google found after research that the loading speed of the largest visual component can most affect the user's perceived loading speed of a web page.
More LCP reference materials
Why choose LCP to represent speed, which components will be taken into consideration, what are the main factors affecting LCP and optimization methods...etc. If you have these questions, please refer to the following documents.
What is FID?
FID, First Input Delay or "First Input Delay", calculates the delay time when the user first interacts with the web page (clicking on a link, clicking on a drop-down menu, filling in a form...etc). This metric represents the responsiveness of a page, indicating whether it responds immediately when a user attempts to interact with the page.
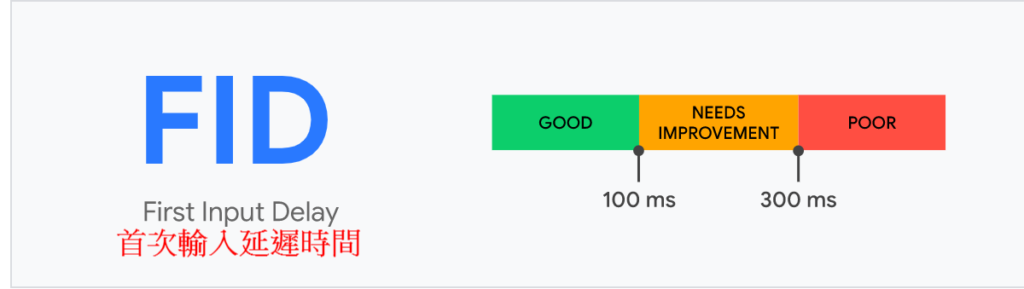
standard:The threshold set by Google for FID is 0.1 seconds. Less than this number is considered a good website experience. In addition, the website must have at least 75% of users reach FID < 2.5s to pass.
FID example
When loading a web page, the browser will not be able to respond to user input immediately because the main thread is busy. As a result, the user may click a button, but the expected effect will appear after some delay.
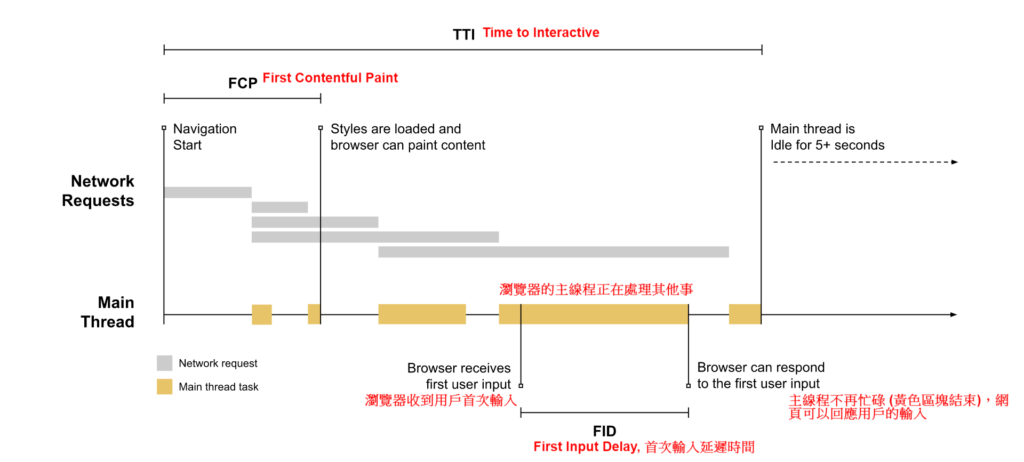
In the above figure, if the user inputs when the main thread is busy, there will be a delay time. FID calculates the delay between the user's first interaction with the web page.
It is worth noting that if the user inputs between the two yellow blocks, that is, inputting when the main thread is idle, there will be no obvious delay (the menu pops up immediately when clicked, and the screen immediately exits abc when the keyboard enters abc...). The significance of
FID in user experience
"First Input Delay (FID)" is the representative of "interactivity" among the three core indicators. Other indicators for measuring interactivity include TTI (Time to Interactive), TBT (Total Blocking Time), etc., but Google finally chose FID as the core indicator of user experience because after research, it was found that the first interaction delay best represents the user's first impression of the quality of the web page, and interactivity problems most often occur when the web page is still loading.
More FID reference materials
Does scrolling count as user input? What counts if the user does not interact with the web page? What counts as "interaction"? Why not use TTI as the interactivity indicator of the web page...etc. If you have these questions, please refer to the following articles. Introduction to
What is CLS?
CLS, Cumulative Layout Shift, or "Cumulative Layout Shift," accounts for the unexpected shifting of web page elements during loading. A webpage that "jumps around" will give readers a very bad user experience.
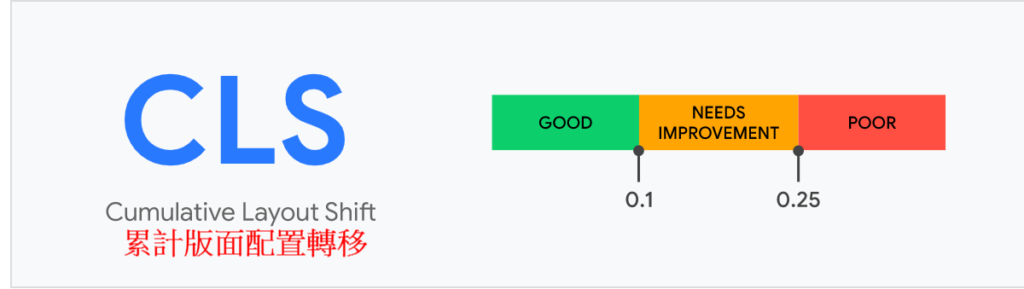
standard:The layout shift score of web page elements is a value between 0 and 1, and CLS is the score addition of all shift situations, so it may be greater than 1. The threshold set by Google for CLS is 0.1. If it is less than this number, it is considered a good website experience. In addition, the website must have at least 75% of users reaching CLS < o.1 to pass.
CLS example
Because the loading time of objects on the web page is different, and the annoying experience of jumping around while reading is numerous, almost all blogs like Pixnet have this problem.
CLS calculation method
Each component shift will have a score. The calculation of this score is元件移位分數(layout shift score) = 影響範圍(impact fraction) * 移動距離(distance fraction), take the following figure as an example. The affected range accounts for 75% of the entire screen (viewport). The moving distance of the component is 25% of the screen height. Therefore, the shift score this time is 0.75*0.25=0.1875.

Cumulative Layout Shift (CLS) is the sum of the scores of unexpected component shifts every time a user browses a web page. The significance of
CLS in user experience
Cumulative Layout Shift" is the representative of "stability" among the three core indicators. A web page that bounces around can easily annoy users, especially now that many web browsing occurs on mobile devices with unstable speeds.
More CLS references
How to distinguish between expected and unexpected component movement, what are the reasons for layout configuration transfer, how to prevent this situation... etc. If you have these questions, please refer to the following articles. Introduction to
Web Vitals Measurement/Monitoring Tool
Before introducing measurement tools, you must first understand the difference between "lab data" and "field data". Taking First Input Delay as an example, the laboratory tool does not try to "interact" with the web page, so this indicator will not appear on measurement tools such as PageSpeed Insights. In the interactive part, it will beTotal Blocking Time (total blocking time, TBT)instead.

TBT / Total Blocking Time / Total blocking time
TBT refers to the total time the main thread is "stuck" between FCP and TTI. TBT is an indicator of interactivity in lab data. In the standards defined by Google, less than 300 milliseconds is excellent; more than 600 milliseconds is unqualified.
For details, please refer to this articleweb.dev article。
browser plug-in
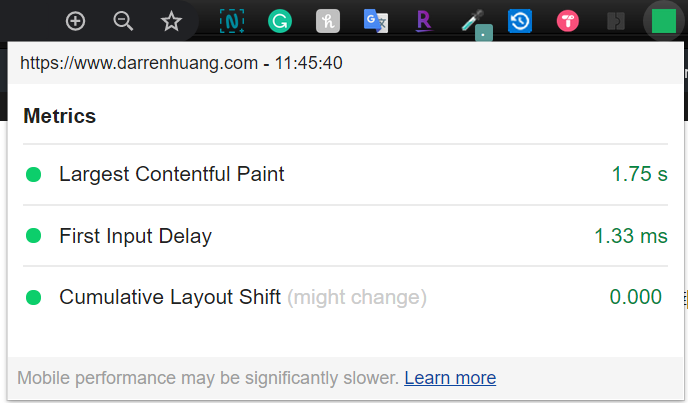
This is officialChrome plug-incan instantly report the LCP, FID, and CLS of the web page while browsing.
Chrome User Experience Report (CrUX Report)
The Chrome User Experience (CrUX) Report is a public database that records the web performance of Chrome users when browsing the web every month. This public data also begins to record three web core vitals.
The picture below shows the web vitals performance of Taiwan’s 104 Labor Bank website in April 2020. The LCP part here can be interpreted as follows:92.08% of users' LCP loading time when browsing the 104 Human Bank website (www.104.com.tw) is good (<2500ms), 4.97% is normal (>=2500ms, <4000ms), 2.91% is bad (>=4000ms), among which 75% of users encounter LCP of less than 1.4 seconds.

Such a picture can be run using Google BigQuery. The details can bereference here。
Google PageSpeed Insights Tool Website Speed Tool
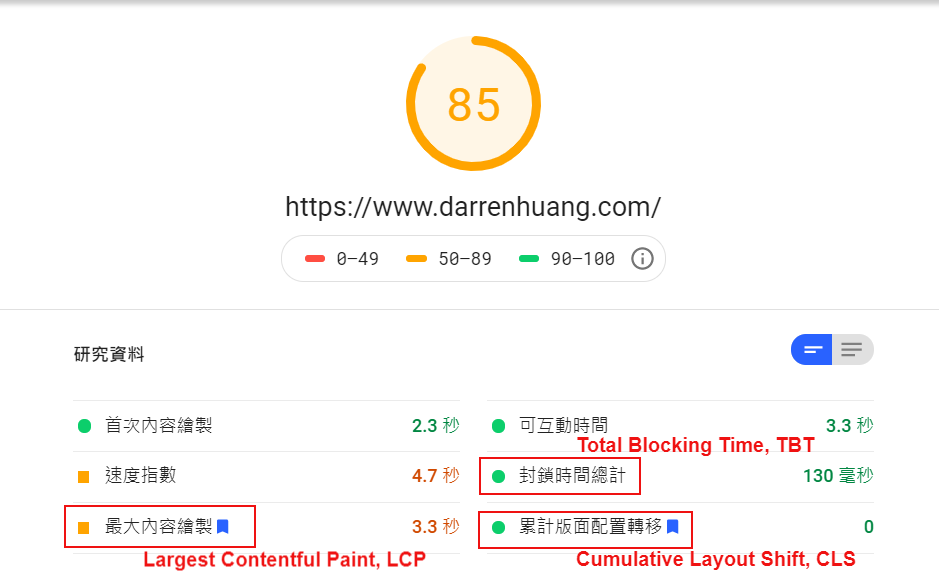
Google The report run byPageSpeed Insights Toolalso includes three web vitals indicators.
Chrome Developer Tools
Lighthouse reports can also be run directly from Lighthouse (formerly Audits) in Chrome's developer tools.

WebPagetest.org
WebPageTestis my favorite tool when testing web page performance. This tool now uses Web Vitals as an important indicator in the report. It will also show the LCP determined by Chrome in the frame-by-frame video loaded on the web page and outline it with a red line.
Twitter/X Post
View original post on Twitter/X
Data Studio data dashboard
There is an official data instrument made using CrUX data. If you are not familiar with BigQuery, you can apply this directly.template。

installationweb-vitalsand make your own tool
developers canweb vitalsThis small library of about 1K is combined with your own tools/websites. You can easily call indicators after installation, such asgetCLS(),getFID(), getLCP(), the official version has quiteComplete Guidecan be referenced.
The above document also provides instructions for recording web vitals data with Google Analytics. After actual operation, the author successfully recorded web vitals into Google Analytics in the form of events.

The following is the code used during testing. If you have a better method, please leave a message to share!
<!-- 將以下代碼加入Header--> <script src="https://unpkg.com/[email protected]/dist/web-vitals.es5.umd.min.js"></script><!– 將以下代碼加入Footer –> <script>
function sendToGoogleAnalytics({name, delta, id}) { // 假設網站已經有一般的GA代碼 ga(‘send’, ‘event’, { eventCategory: ‘Web Vitals’, eventAction: name, // GA裡的event value必須為整數,因此四捨五入 // 另外CLS分數會乘以1000 eventValue: Math.round(name === ‘CLS’ ? delta * 1000 : delta), // 每一次的頁面載入都有獨特的“ID”,用以累加CLS eventLabel: id, // 將事件設為非互動性(non-interactive) nonInteraction: true, }); }
addEventListener(‘DOMContentLoaded’, function() { webVitals.getCLS(sendToGoogleAnalytics); webVitals.getFID(sendToGoogleAnalytics); webVitals.getLCP(sendToGoogleAnalytics); });
</script>
Google Webmaster Tools
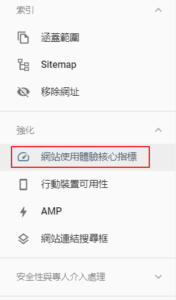
In Google Search Console, the original "Speed Report" was changed to "Website Experience Core Indicator Report". The data source is CrUX, which means the data of actual users browsing the website.official documenthas more explanation.
Conclusion
Website performance (Web Performance) is an area that SEO work often comes into contact with. Now with the three standard indicators selected by Google for everyone, you can save some time in determining KPIs when discussing with engineers. In addition, Google announced that it will list web vitals as a ranking factor. Presumably optimizing these items will become the goal of many webmasters in the second half of the year.
The above is the author's arrangement of this web vitals project. If there are any errors or unclear points, please leave a message to correct me. If such content is helpful to you, please subscribe to the newsletter or followdigital engineFacebook fan page!
Related reading
FID to INP: Historical conversion of interactive response speed metrics
Save the 2023 record Core Web Vitals indicator conversion instructions, from user interaction to the next screen drawing, to understand the experience issues that INP wants to measure.
Core Web Vitals official Q&A: historical notes on scores, information and rankings
Save the official Q&A compiled before the launch of Core Web Vitals in 2021, focusing on the data calculation methods and ranking impact boundaries of LCP, FID, and CLS.
Mobile content-first indexing: Dynamic Serving Don’t forget Vary
Save a working case that explains why HTTP's Vary: User-Agent may become an important cache signal when Dynamic Serving returns different HTML based on User-Agent.